Gender, Race, and Education.
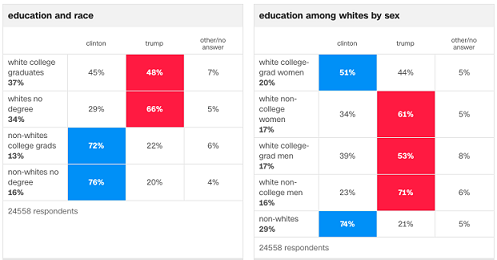
The 2016 Election was an incredibly bitter and divisive campaign. The chart above is an exit poll from the 2016 election. Political scientists use exit polls to make predictions about the results, but more importantly to better understand the mood of the electorate and look for differences among voters. Analyze the charts and answer the questions that follow.
Questions for Completion
1. Identify at least three voting behaviors based on your analysis of the charts.
2. Develop at least two hypotheses for one of the behaviors you identified.
3. Do you expect these voting patterns to remain the same from 2016 to 2020? Why or why not?
Photo/Image: CNN Exit Poll, 2016.