Mass Media and 2016 Election
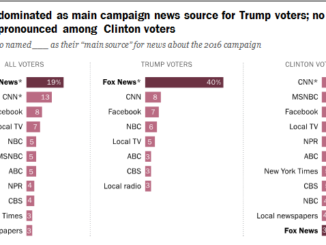
News Source and Presidential Preference. The 2016 Election demonstrated a deeply divided electorate between those in rural and urban America. The trend does not stop […]
News Source and Presidential Preference. The 2016 Election demonstrated a deeply divided electorate between those in rural and urban America. The trend does not stop […]
A Failure of a Linkage Institution? The media is one of several critical linkage institutions that connect the American people to politics and government. Historically, […]
Big Poll Discovers the Middle. It is usually insightful to examine public opinion over multiple issues and across time. Now over a decade old, this […]
Reliable Measures of Public Opinion. Some of the most reliable polling comes from the Gallup Poll. George Gallup is the father of modern day polling […]
2019 Tax Brackets. The United States has a progressive tax code, that is, the more income a U.S. resident earns, the higher their rate of […]
Copyright © 2026 | WordPress Theme by MH Themes