FRQ #2, Quantitative Analysis.
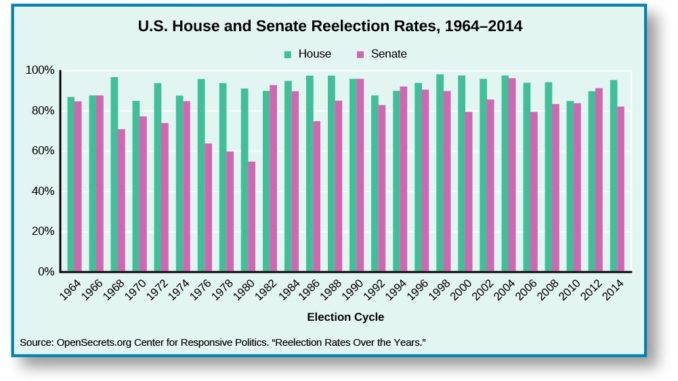
The bar graph above shows reelection rates for members of the House and Senate. Based on the bar graph and your knowledge of American politics, complete the following prompts.
(A) Identify two trends based on this graph.
(B) Explain how ‘franking’ contributes to one of the trends identified in response (A).
(C) Identify two other factors, aside from franking, that contribute to incumbency reelection rates.
(D) Discuss one consequence of incumbency advantage on the American political process.